Research and User Testing
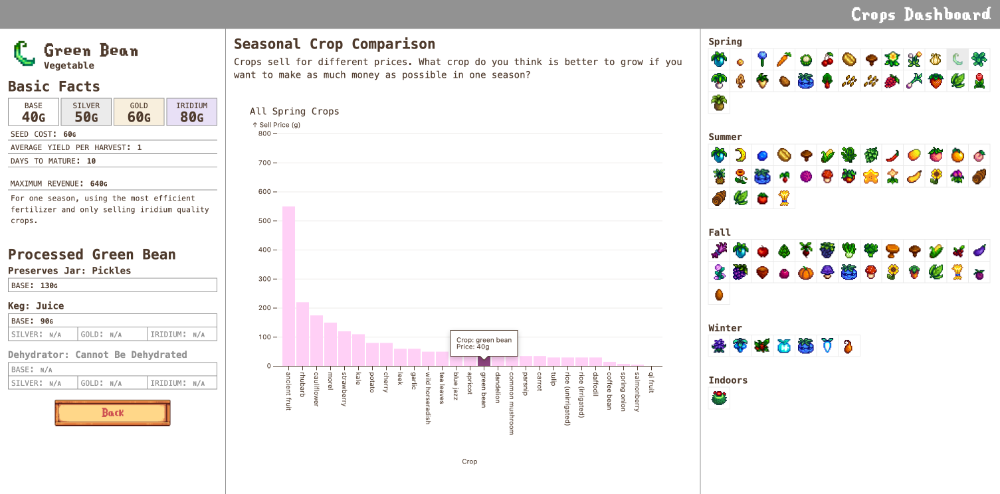
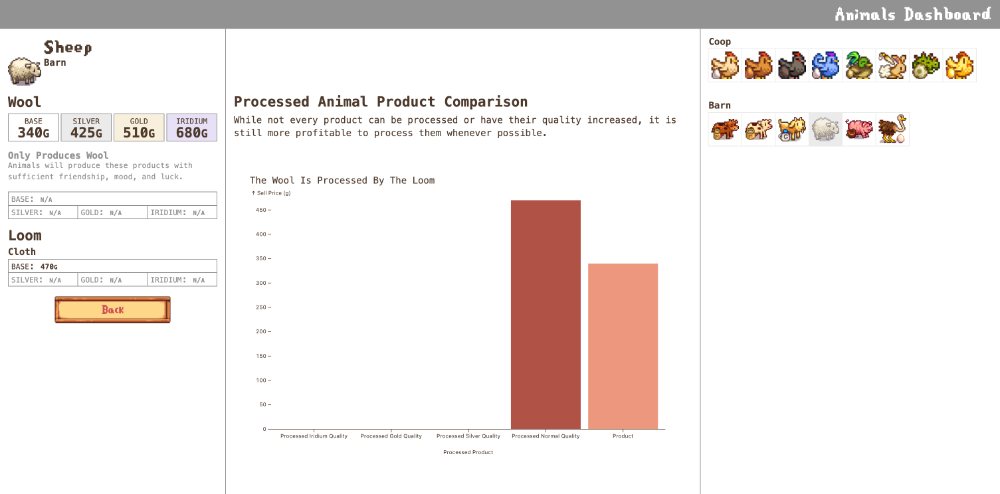
Initially, this project focused on crop pricing. We conducted EDA to establish trends in availability and effects of gameplay mechanics such as processing to increase in-game profits.
We preseted charts created in Tableau to three participants and asked them a series of question to guage understanding. All participants were Stardew Valley players with varying levels of experience, ranging from newbie to advanced. Participants were selected via professional and academic networks, with the intent of capturing a representative cross-section of target users. Participation was voluntary, and each participant signed an informed consent form prior to the session. This form disclosed the scope of the study, confidentiality provisions, and confirmed whether the session would be audio/video recorded.
Participants
| Participant 1 | Participant 2 | Participant 3 | |
|---|---|---|---|
| Age | Early 20s | Late 20s | Mid 20s |
| Familiarity with Stardew Valley | First played a year ago | 5 years of experience | First played about 2 years ago |
| Expertise (Self-Reported) | Newbie | Advanced | Casual |
| Tools Used Previously | Stardew Valley Wiki | Stardew Valley Wiki, YouTube guides | Stardew Valley Wiki, Stardew Valley Planner |
Our participants were all college-educated women with various experience with Stardew Valley and familiarity with in-game farming mechanics. Furthermore, they have all employed third-party tools help make gameplay decisions.
Test Measures
During the usability testing, we measured several key metrics to understand users’ perception of our design:
-
Time on Task
We recored how long it took each participant (in seconds and/or minutes) to complete tasks such as finding the most profitable crop in a given season while using our infographic versus an existing external wiki guide in order to quantify how intuitive and efficient our dashboard was to use. A shorter time generally indicated that users could quickly understand and navigate the interface.
-
User Satisfaction
During each session we used Likert-scale questions and open-ended questions to gauge users’ overall satisfaction with our design. This included whether the dashboard was frustrating to use or if they would use this dashboard when they play Stardew Valley. Other feedback included suggestions for iterations that would increase overall user satisfaction.
-
Comparison to other tools
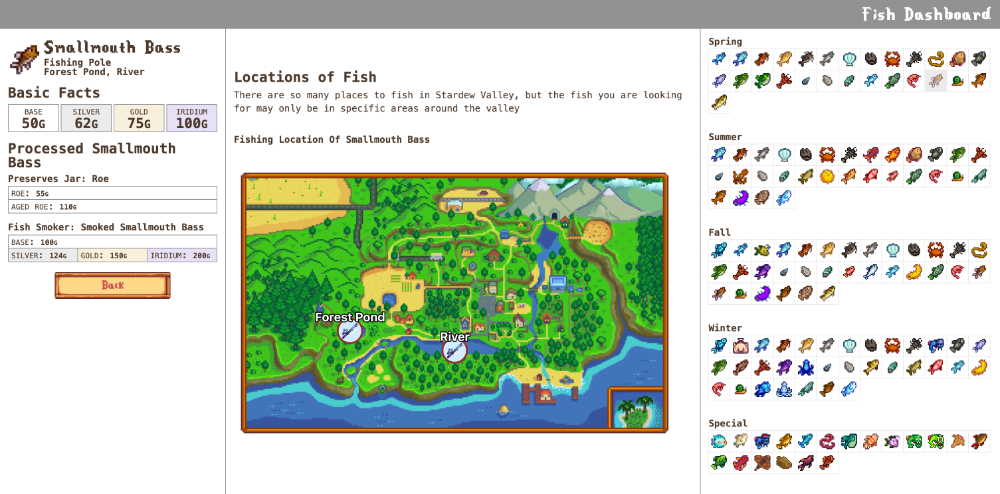
Since Stardew Valley players often rely on external guides such as the Official Stardew Valley Wiki to access detailed in-game profits information, we asked participants to compare our dashboard to the wiki by completing the same tasks with both tools. We wanted to know whether they found our dashboard more visually appealing and easier to navigate in comparison to finding the same information through the wiki pages.
Overall the participants struggled to interpret some of the labels of the graphs and the overall structure of the visualizations including unclear axis titles and terminology. Less advanced players expressed more confusion and less certainty over the purpose and functions of the visualizations. All participants spoke their questions aloud while working through tasks, suggesting persistent ambiguity around how to get started or interact with the data effectively. One participant was unsure if clicking would reveal more information and didn’t initially realize the dashboard was interactive. Another initially missed that the visualizations required scrolling and expected immediate results from clicking the icons.
Despite initial confusion, none of the participants found the visualization difficult to use overall. Participants 1 and 3 expressed enthusiasm for the tool’s potential future uses of the visualization. Participant 3 specifically mentioned that using the visualization for information was preferable to using the Stardew Valley Wiki. All participants expressed a desire for the visualizations to have additional context and data available. Participant 3 suggested information for other items in the game. Interestingly, it took participants a minute longer on average look up information via Stardew Valley Wiki than it did our visualization for the purposes of crop comparision despite prior familiarity with Stardew Valley Wiki.